Dashboard
Introduction
A dashboard is the information management tool that visually tracks, analyzes and displays key performance indicators (KPI), metrics and key data points to monitor the health of Telostat. We use dashboard to display data visualizations in a way that is immediately understood. The dashboard is linked to a database that allows the reports to be constantly updated.
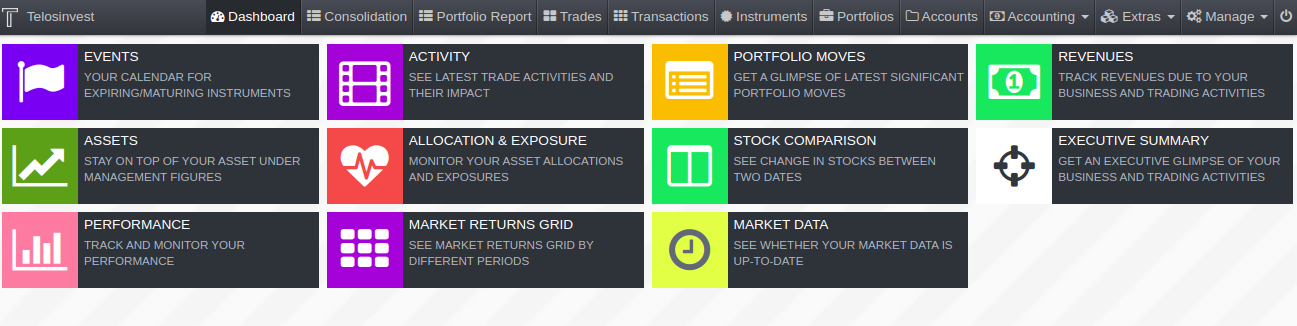
In the dashboard we show our collection of widgets that give an overview of the reports and metrics we care about the most. The widgets are mostly customizable, configurable and new ones can be added according to your requirements.
Widgets
Widgets are the basic building blocks of a dashboard. Within the dashboard design, you can add different widgets to perform functions. For example, widgets can calculate key performance indicators, filter dashboard results, visualize your data using interactive charts, and show record-level details in tables.
Widgets that display data require a query. A widget determines how to use or display the results returned by a query.
Our current widgets are:
- Events
- Activity
- Portfolio Moves
- Revenues
- Assets
- Allocation & Exposure
- Stock Comparison
- Executive Summary
- Performance
- Market Returns Grid
- Market Data
Events
In this widget you will be able to manage your calendar for expiring or maturing instruments.

In the calendar events you select the period of time to display the events and you can filer this events by Date, Name, Type, Quantity, Account, Portfolio, Team or Custodian.
You can download a report with the Table Data of Events.
Activity
In this widget you will see the latest trade activities and their impact.
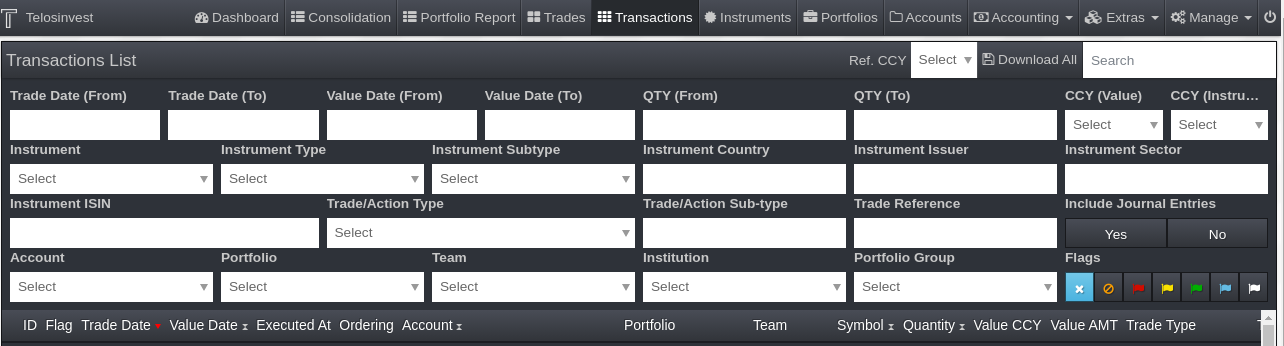
In the Transaction List you select the CCY Reference and you can filter the transactions by Trade Date (From), Trade Date (To), Value Data (From), Value Data (To), QTY (From), QTY (To), CCY (Value), CCY (Instrument), Instrument, Instrument Type, Instrument Sub-type, Trade Reference, Account, Portfolio, Team or Portfolio Group.
You can download a report with the Table Data of Transactions.
Portfolio Moves
In this widget you will get a glimpse of latest significant Portfolio Moves.
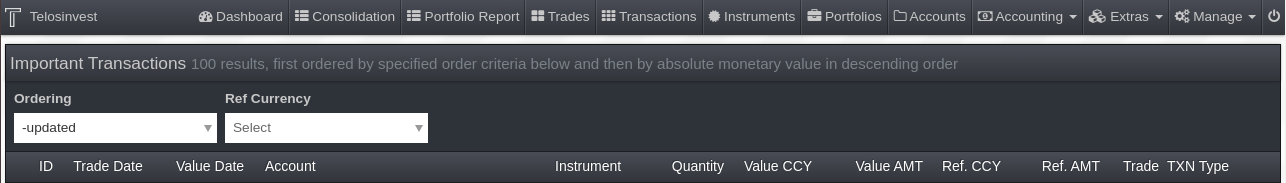
In the Important Transaction Section, 100 results will be displayed, first ordered by specified order criteria below and then by absolute monetary value in descending order.
You can download a report with the Table Data of Transactions.
Revenues
In this widget you will track revenues according to your business and trading activities. Revenue is the total amount of income generated by the sale of goods or services related to you business primary operations.
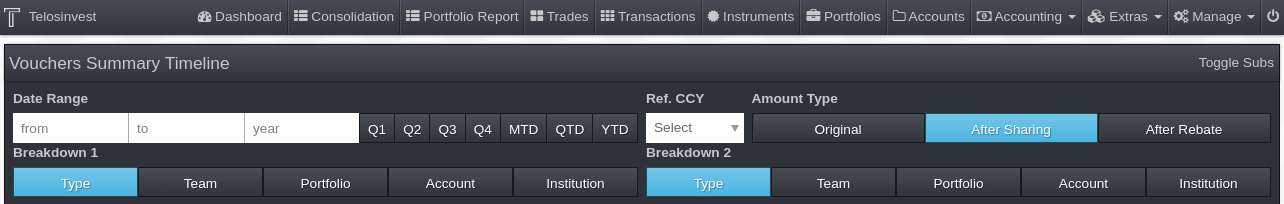
In the Vouchers Summary Timeline you select the Date Range and the CCY Reference. As well, you can select the transactions by Amount Type. For the Breakdown 1 and Breakdown 2 you will be able to filter the vouchers by Type, Team, Portfolio, Account and Institution.
You can download a report with the Table Data of Vouchers.
Assets
In this widget you will stay on top of your Asset under management figures. Assets are the practice of using a company's balance sheet assets (such as investments or inventory) as a security to borrow money or take out a loan against what you already own. It can provide a secure and easy way of getting working capital for your business.
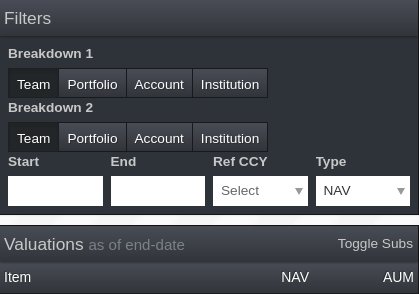
For the Breakdown 1 and Breakdown 2 you will be able to display the data by Type, Team, Portfolio, Account or Institution. Furthermore, you can filter the data by Star date, End date, Ref CCY and Type.
In the Valuations Table, the data will be displayed by Item, Net Asset Value (NAV) and Assets under management (AUM).
You can download a report with the Table Data of Valuations.
In this widget you will monitor your asset allocations and exposures. An allocation is the process of shifting overhead costs to cost objects, using a rational basis of allotment. Allocations are most commonly used to assign costs to produced goods, which then appear in the financial statements of a business in either the cost of goods sold or the inventory asset.
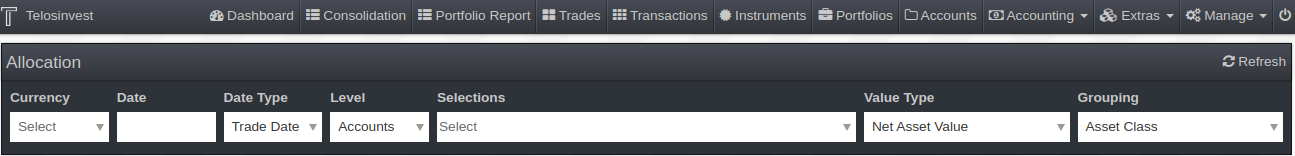
In the Allocation section you can filter by Currency, Date, Date Type, Level, Selections, Value Type or Grouping.
Stock Comparison
In this widget you will see change in stocks between two given dates.
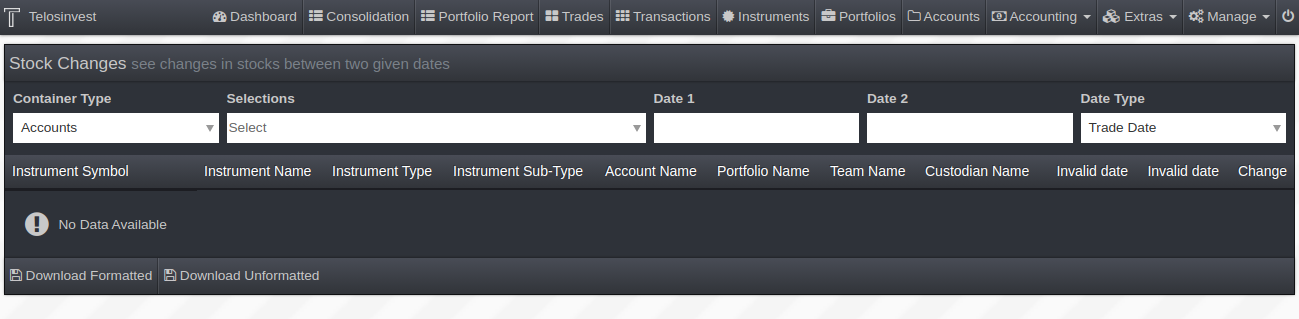
In the Stock Changes you can select the Container Type, it Selections, Date 1, Date 2 and Data Type.
You can download a Formatted or Unformatted Report with the Table Data of Stock Changes.
Executive Summary
In this widget you will get an executive glimpse of your business and trading activities.

In the Executive Summary you can select Currency Reference and display the info by Team or Institution.
You can download a report with the Table Data of the Executive Summary.
Performance
In this widget you will track and monitor your performance. This widget is a Beta feature. Financial performance is a subjective measure of how well a business can use assets from its primary mode and generate revenues. The term is also used as a general measure of a firm's overall financial health over a given period.
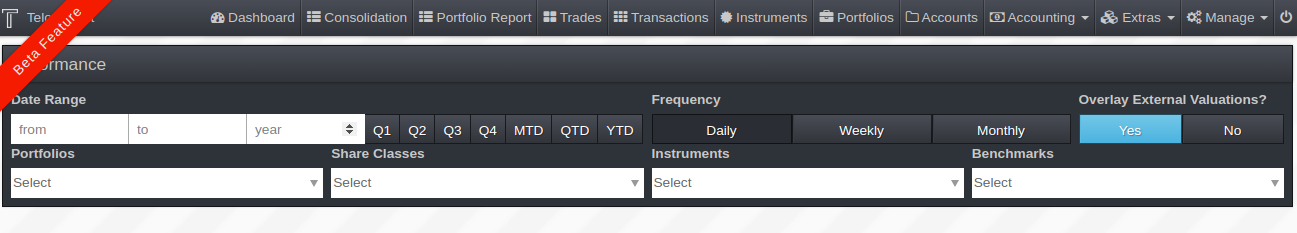
In the Performance section you can select the Data Range and Frequency. We have the option to overlay external valuations and we select the Portfolios, Share Classes, Instruments and Benchmarks.
You can download a Formatted or Unformatted report with the Table Data of Performance.
Market Returns Grid
In this widget you will see market returns grid by different periods. This widget is a Beta feature.
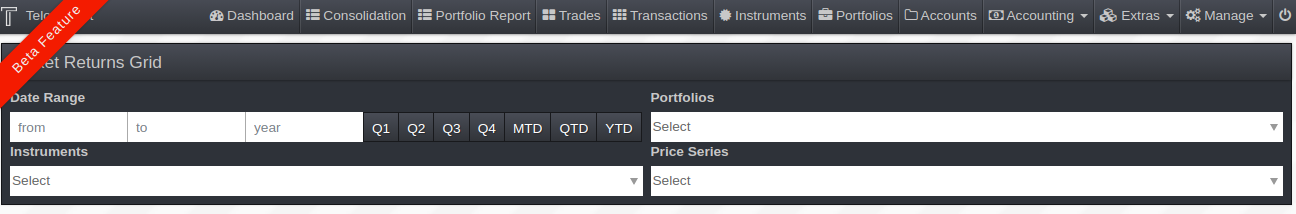
In the Market Returns Grid section you can select the Data Range and Portfolios, Furthermore, we select the Requirements and the Price Series.
You can download a report with the Table Data of Market Returns Grid.
Market Data
In this widget you will see whether your market data is up-to-date.
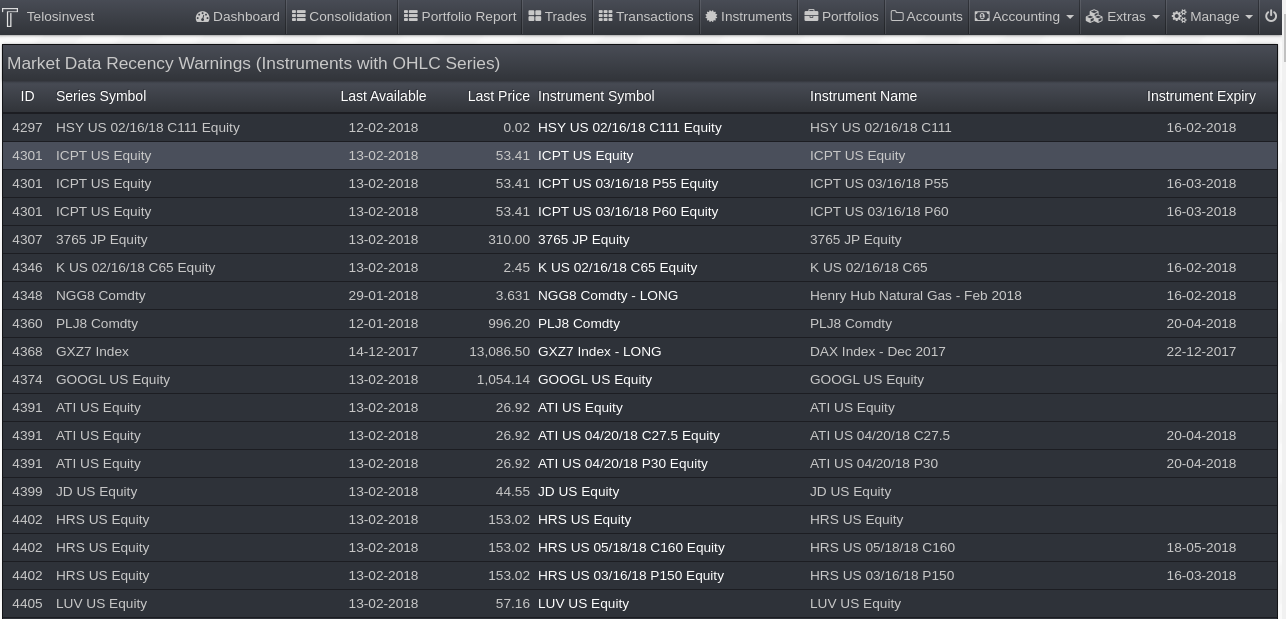
In this widget you can consult the Market Data Recency Warnings (Instruments with OHCL Series).
You can download a Report with the Table Data of Market Data Recency Warnings.